First Image Data Acquisition by Compact Infrared Camera (CIRC) onboard DAICHI-2
Compact Infrared Camera (CIRC) is a technology demonstration payload onboard the DAICHI-2. CIRC is an infrared sensor intended for observing forest fires, volcanoes, and heat island phenomena. Since the initial functional verification phase (July 4-14, 2014), CIRC has acquired the following images of Earth. CIRC was demonstrated to function according to its intended design. After the calibration validation phase, which will confirm the temperature accuracy of observed data, CIRC data will be available to the public December 2014 onward.
Night observation of the Chugoku region and Shikoku in Japan
Image 1 shows the Chugoku region and Shikoku in Japan at around midnight (JST 23:44). This image demonstrates the advantage of infrared sensors, which can obtain images even at night. The image color represents surface temperature, with black representing the lowest temperature and yellow represent the highest.
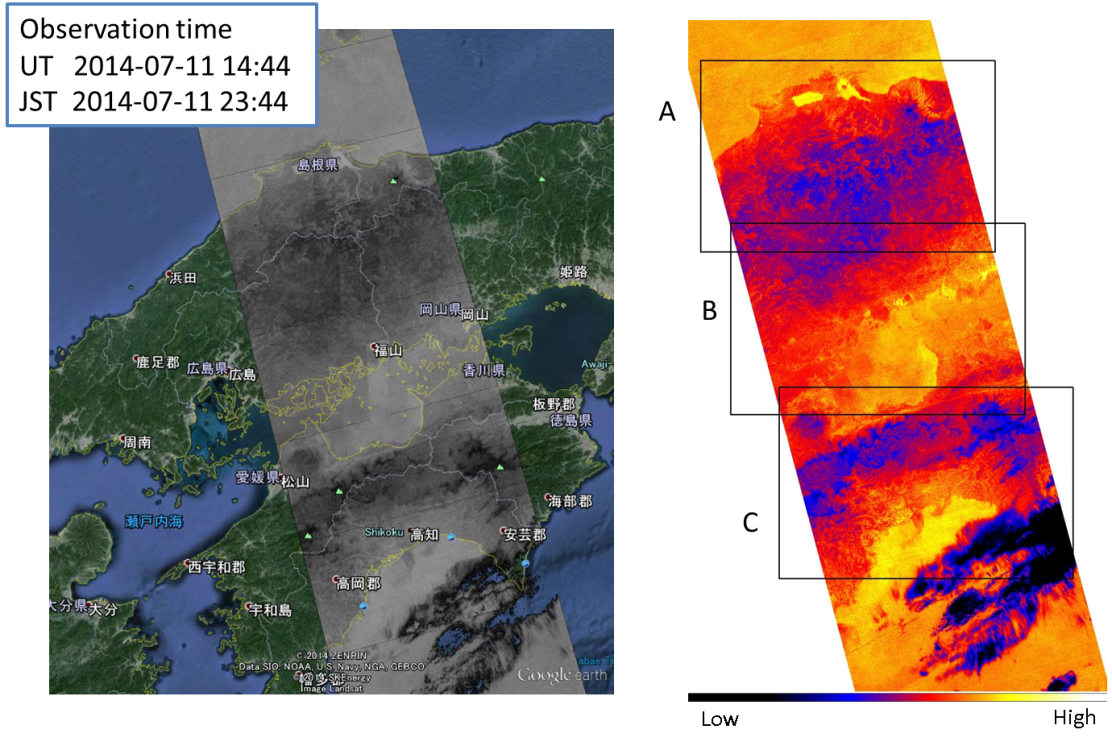
Image 1. Night image of the Chugoku region and Shikoku in Japan (JST 23:44).
Image 2 is a zoom of region A from Image 1. As the color of an infrared image represents surface temperature, the Chugoku Mountains, such as Daisen, are shown in blue. Lakes Shinji-ko and Nakaumi are also visible, and their temperatures are different from that of the Sea of Japan.
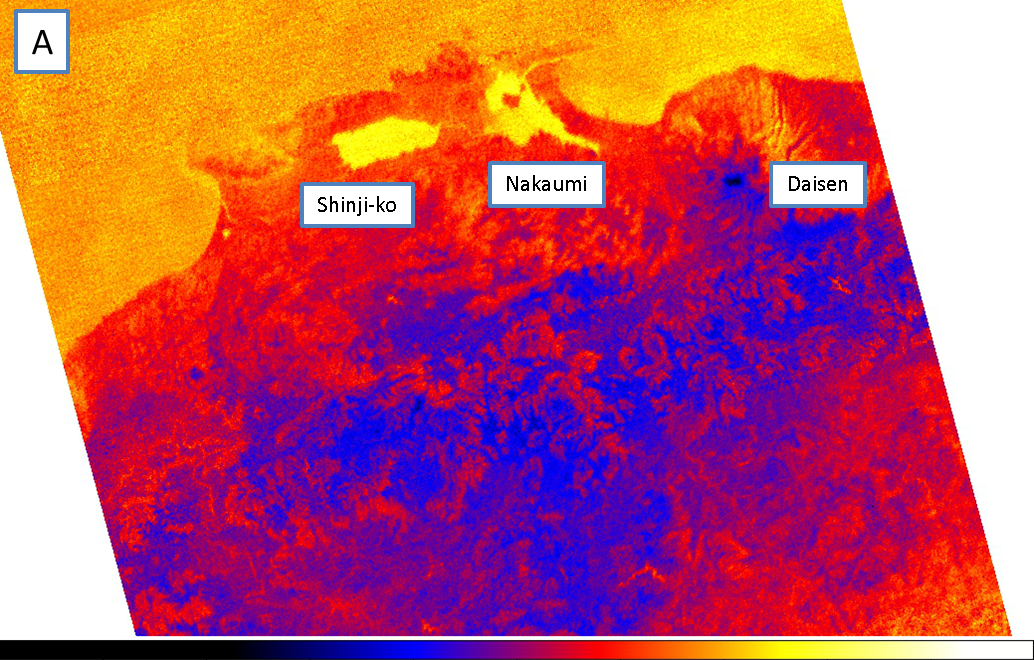
Image 2. Zoom of the region A from image 1.
Image 3 is a zoom of region B from Image 1. There are many islands visible in the Seto Inland Sea. The temperature distribution of the Seto Inland Sea is also apparent. Fukuyama City and Kurashiki City contain industrial areas such as steel plants and, thus, are colored yellow.
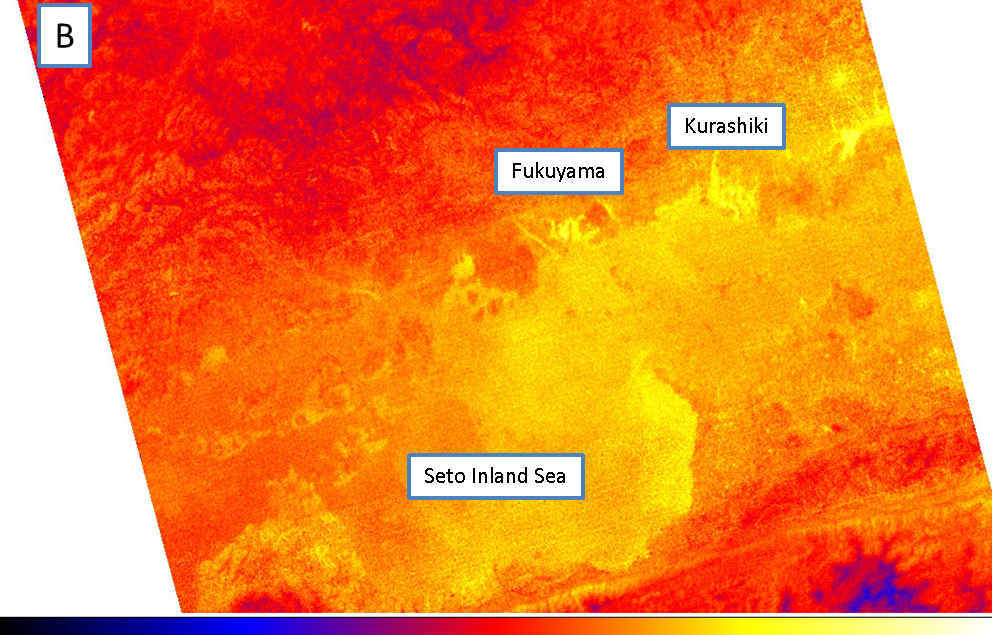
Image 3. Zoom of the region B from image 1.
Image 4 is a zoom of region C from Image 1. The Niyodo River can be seen flowing through Kochi City and mixing with the Pacific Ocean. Clouds are colored black as they are at a higher altitude than mountains.
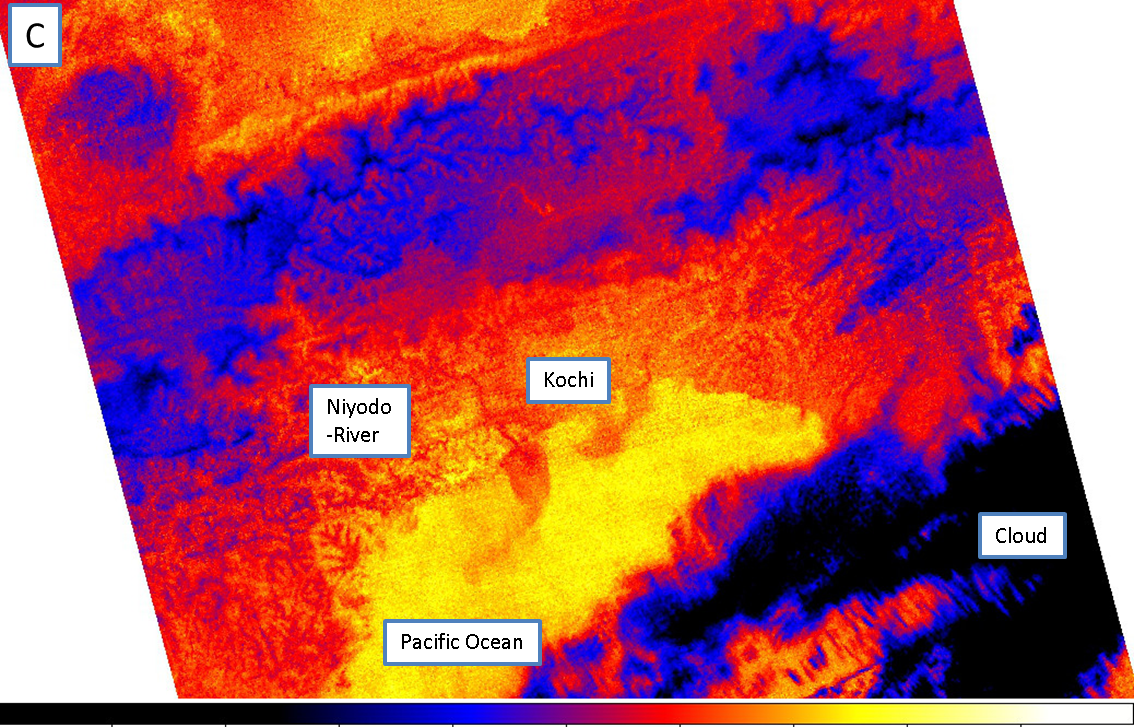
Image 4. Zoom of the region C from image 1.
Daytime observation of Chicago
Image 5 shows Chicago, IL, observed on July 21 at CST 13:40. As the land-water temperature difference is larger during daytime than during nighttime observation, a coast line is clearly visible.
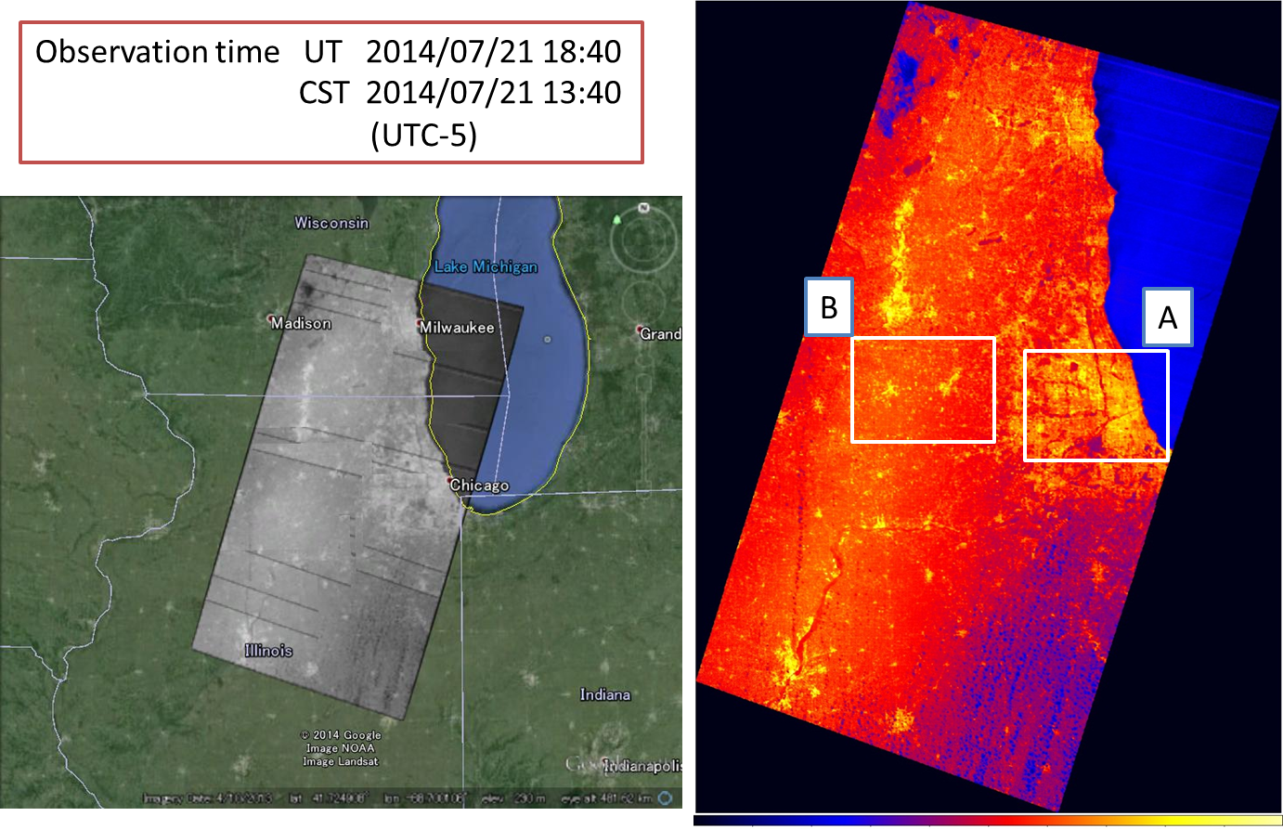
Image 5 Daytime image of Chicago in the stats of Illinois. (CST 13:40).
Image 6 shows a zoom of downtown Chicago (region A) from Image 5. The temperature of the main urban area displays a higher temperature than that of suburban areas. Thus, CIRC data may be utilized to observe the heat island effect in a city.
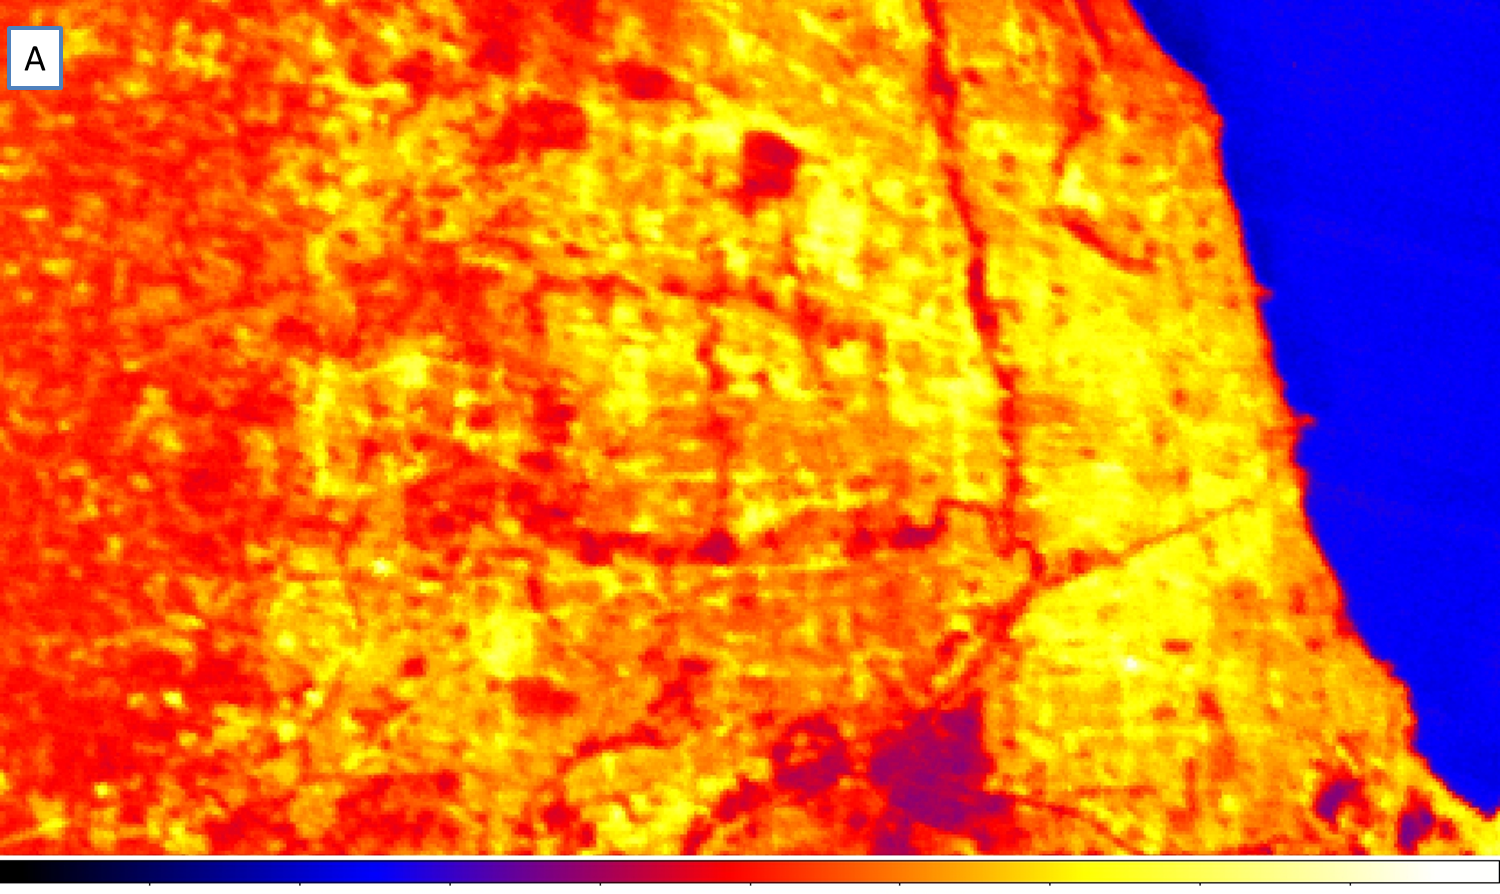
Image 6. Zoom of the region A from image 5.
Image 7 shows a zoom of region B from Image 5. A grid of streets and avenues is visible around the city. Despite the relatively large spatial resolution of CIRC (200 m) compared to the width of roads (<60 m), the road pattern is still apparent due to the stark temperature difference between the roads and other surrounding areas.
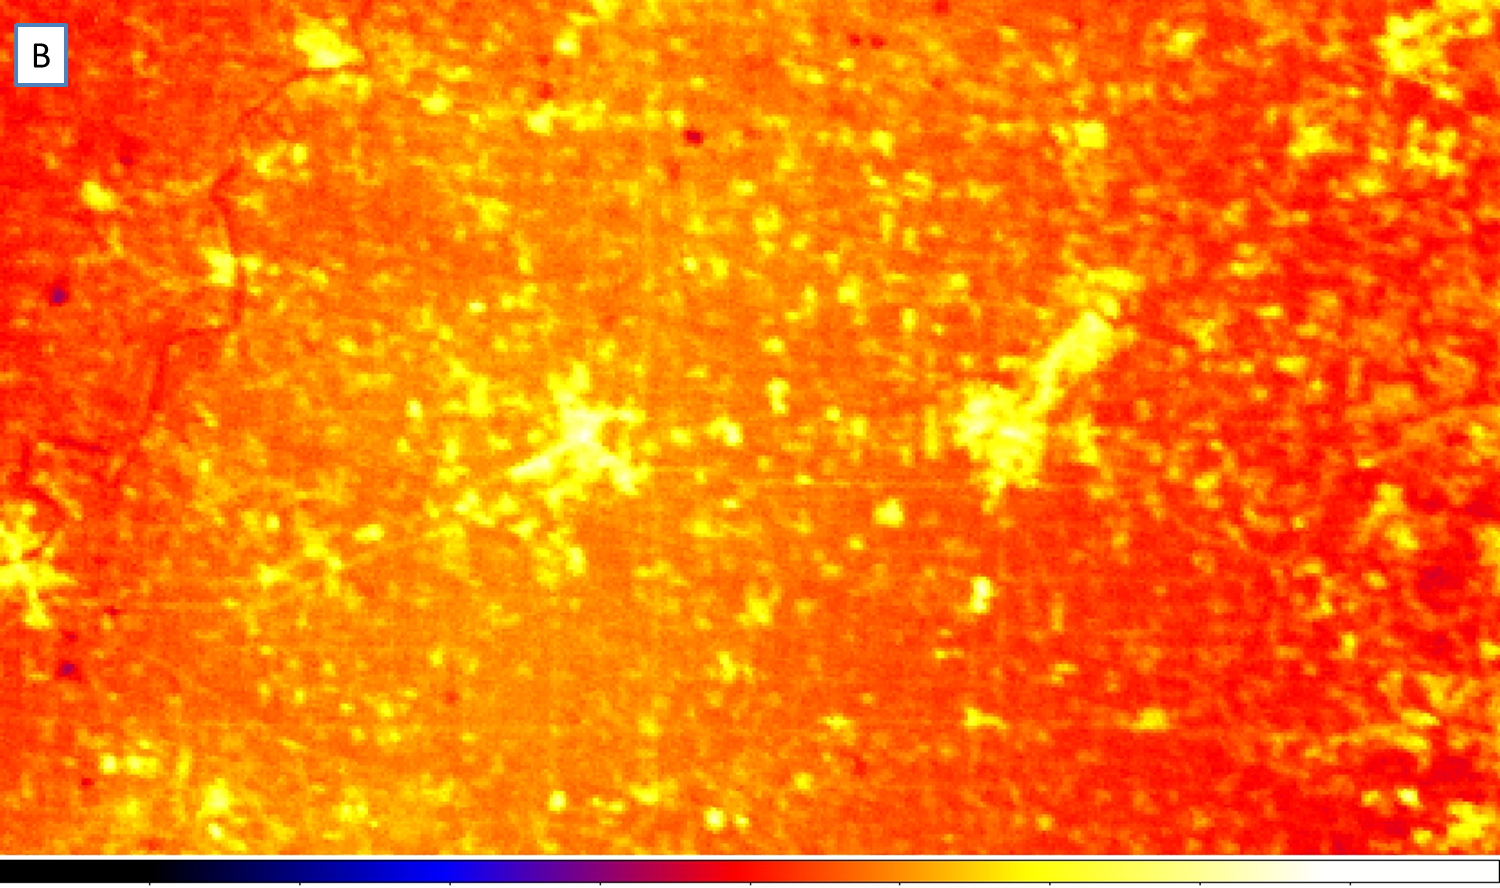
Image 7. Zoom of the region B from image 5.
Wildfire detection by CIRC in California
Image 8 shows a night image of California on July 27 at PST 00:20. Due to the extremely dry conditions in California, wildfires are common and are sometimes detected by satellites. The left CIRC image from Image 7 is overlapped with wildfire detection results from the VIIRS sensor onboard the Suomi NPP satellite. Red marks represent the positions of wildfires detected during the first 6 hours of July 28.
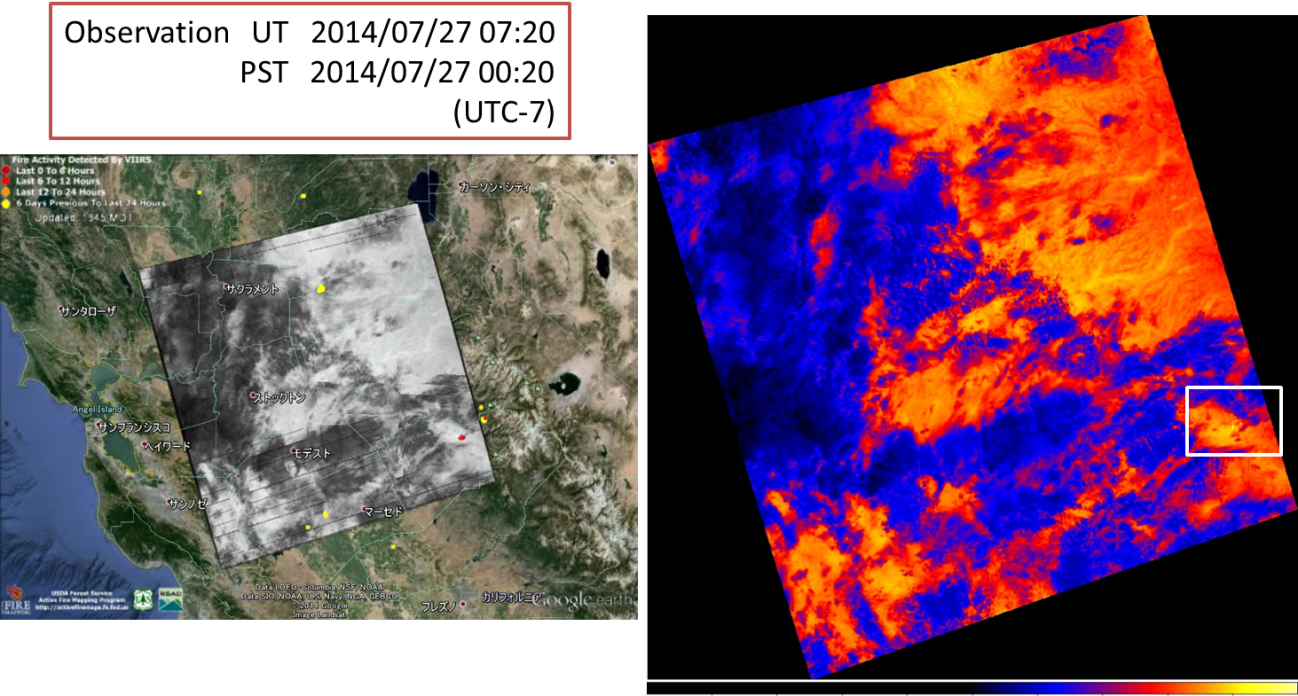
Image 8 Night image of California (CST 00:20).
Image 9 shows a zoom of the white region from Image 8. In the right CIRC image, several high-temperature yellow hot spots correspond to wildfire positions detected by the Suomi NPP/VIIRS sensor. Therefore, CIRC data can be utilized for early detection of wildfires or for prevention of wildfire expansion.
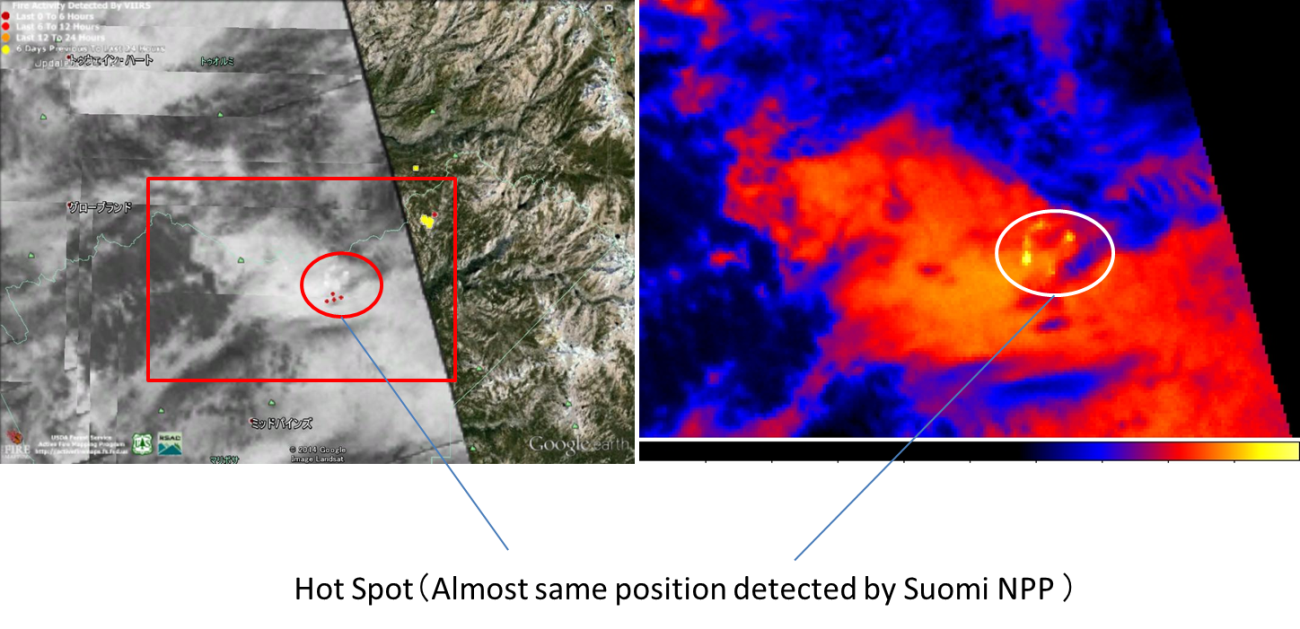
Image 9. Zoom of the white square region from Image 8.